
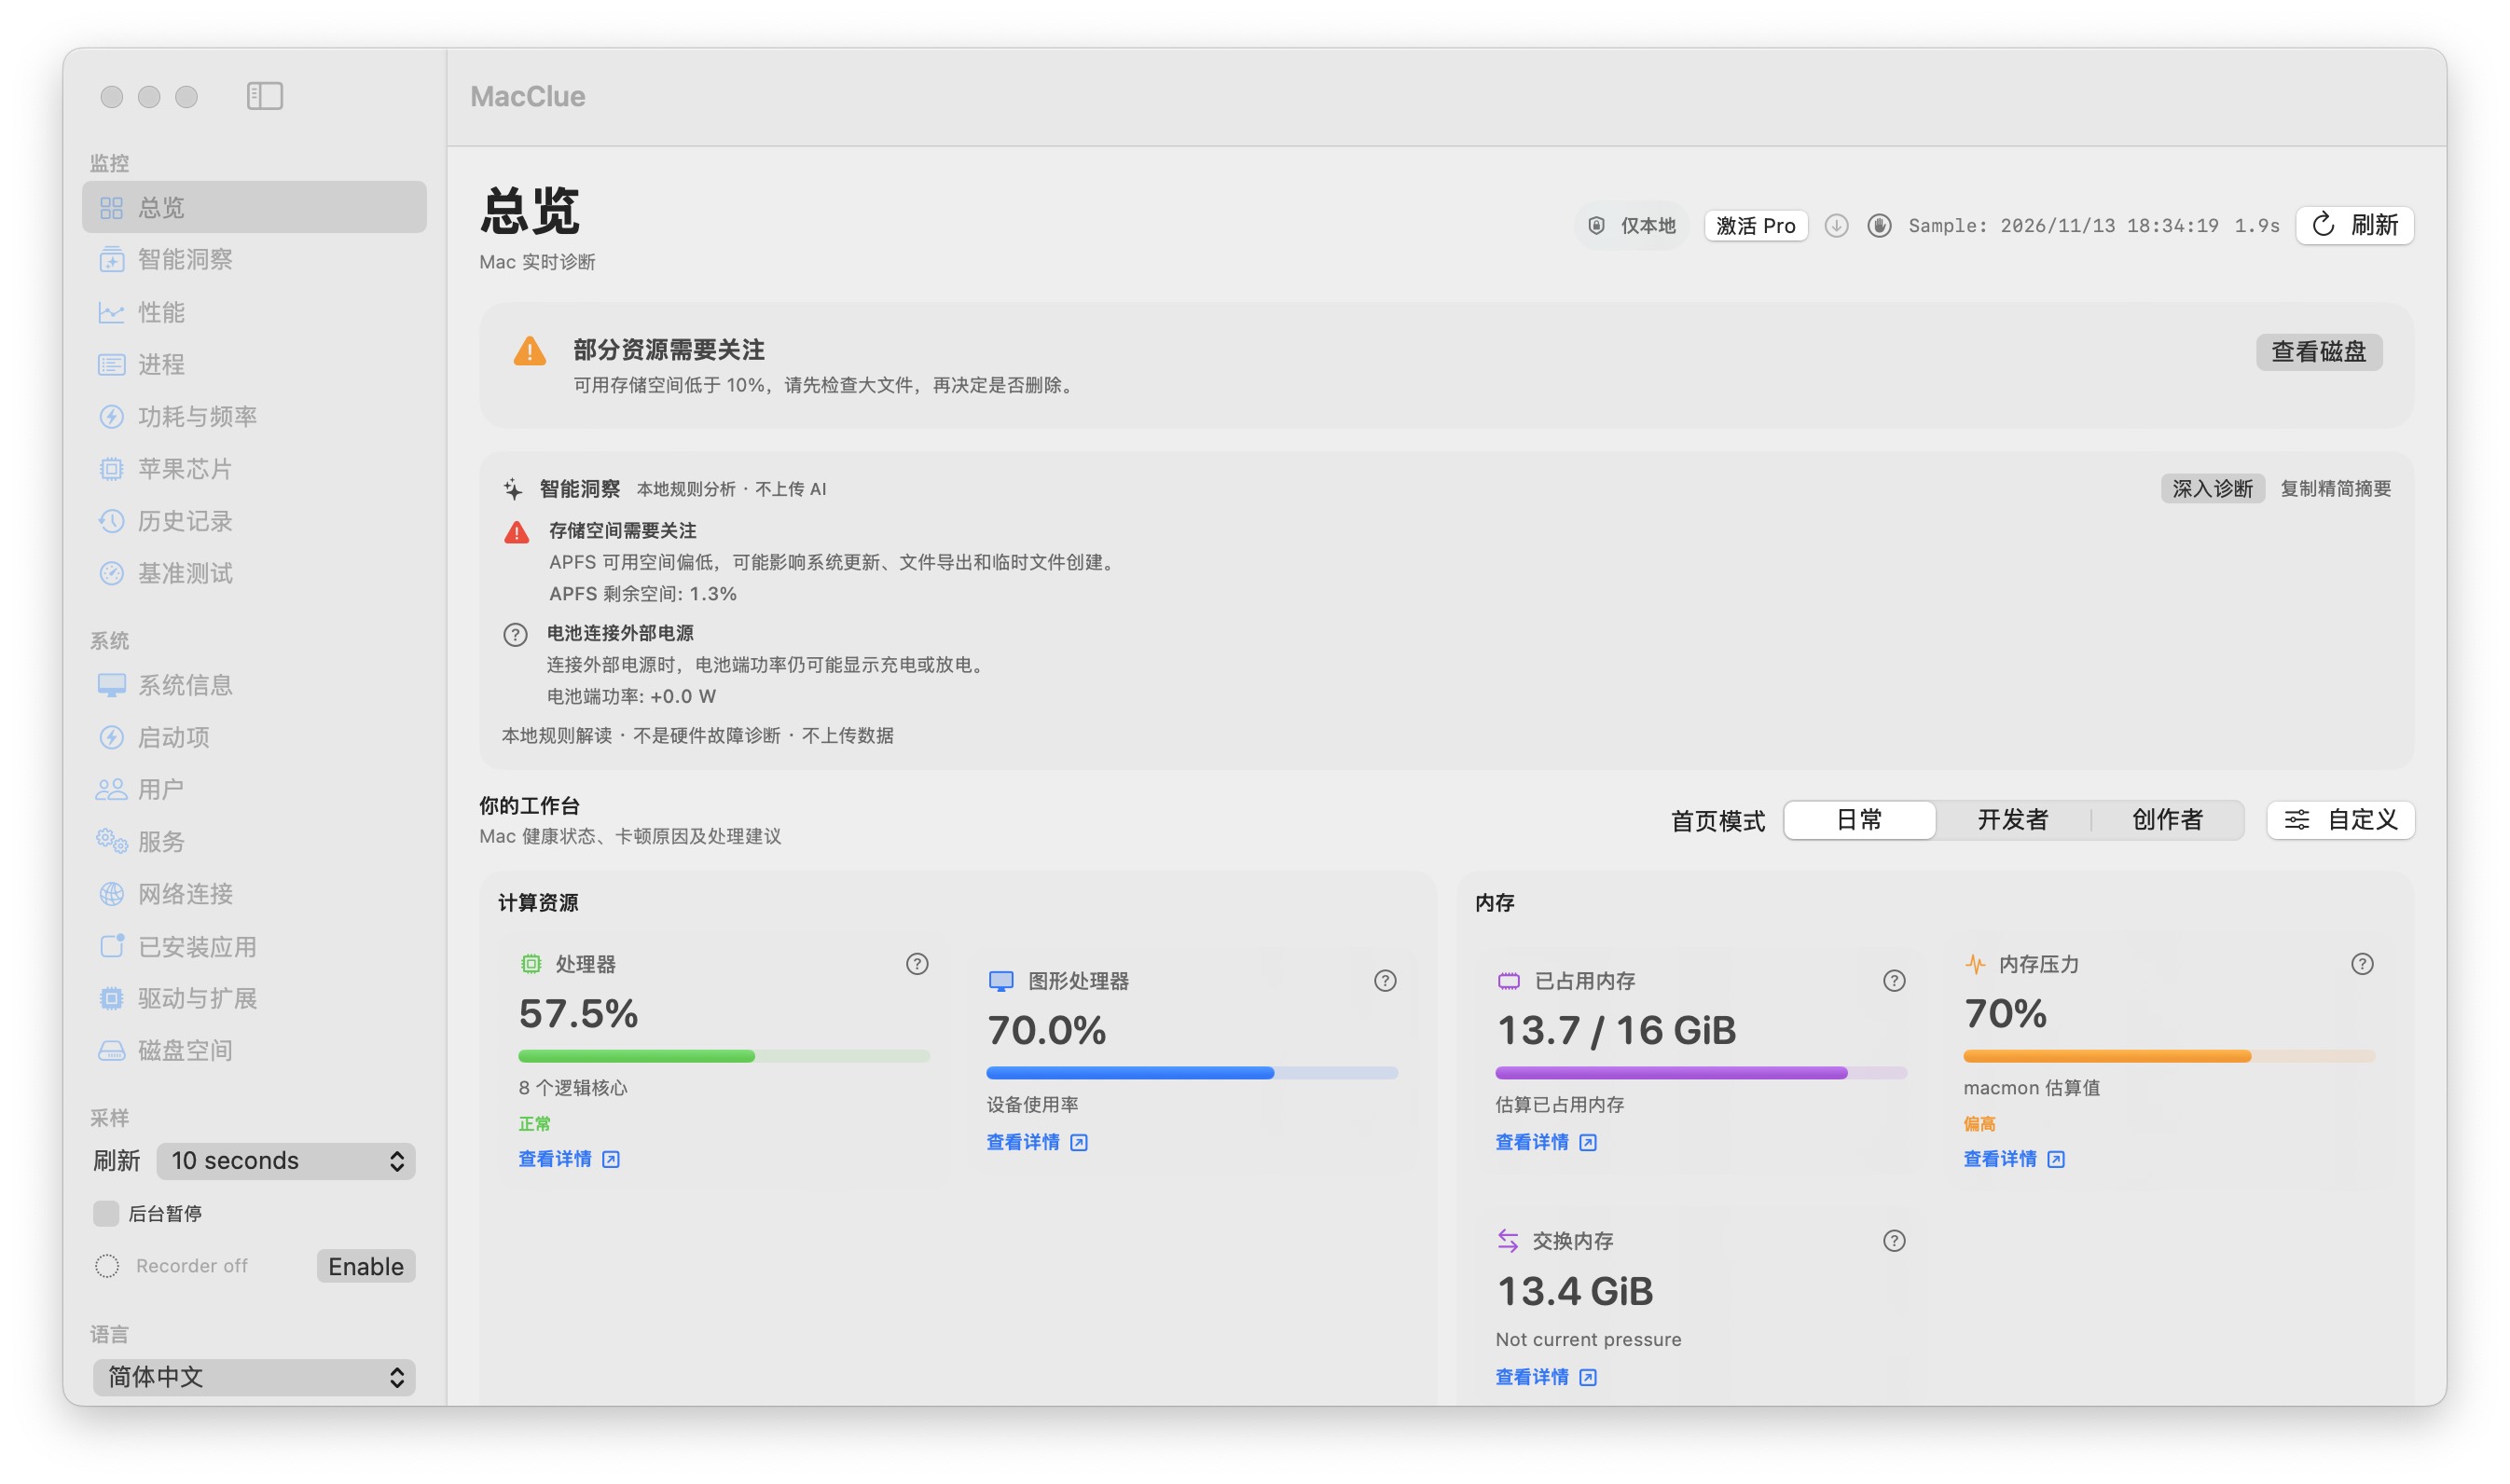
Start with the overview
Look at CPU activity, GPU utilization, memory use and available storage together. A single high percentage does not necessarily mean a problem: examine the surrounding workload and whether the spike persists.
Understand where each number comes from
CPU usage is based on macOS processor accounting; memory and swap reflect system statistics. GPU readings depend on information published by the particular Mac. Missing or unsupported readings are shown as unavailable rather than invented.
Drill into busy processes
Sort processes by CPU or resident memory, inspect identity and ownership, and confirm whether the app is performing a legitimate task before taking action. Safe termination requires a separate explicit confirmation.
Compare samples, not isolated numbers
Select a time window and look for patterns. If the computer feels slow but CPU is calm, memory pressure, storage availability, or disk activity may be more useful leads.
What to know before relying on this feature
Available readings differ between Mac models and macOS versions. MacClue is a diagnostic aid, not a hardware certification or repair tool.
See for yourself
Download the verified beta and compare its readings with macOS Activity Monitor and System Settings. Results depend on your model and permissions.
Mac 版をダウンロード